Console
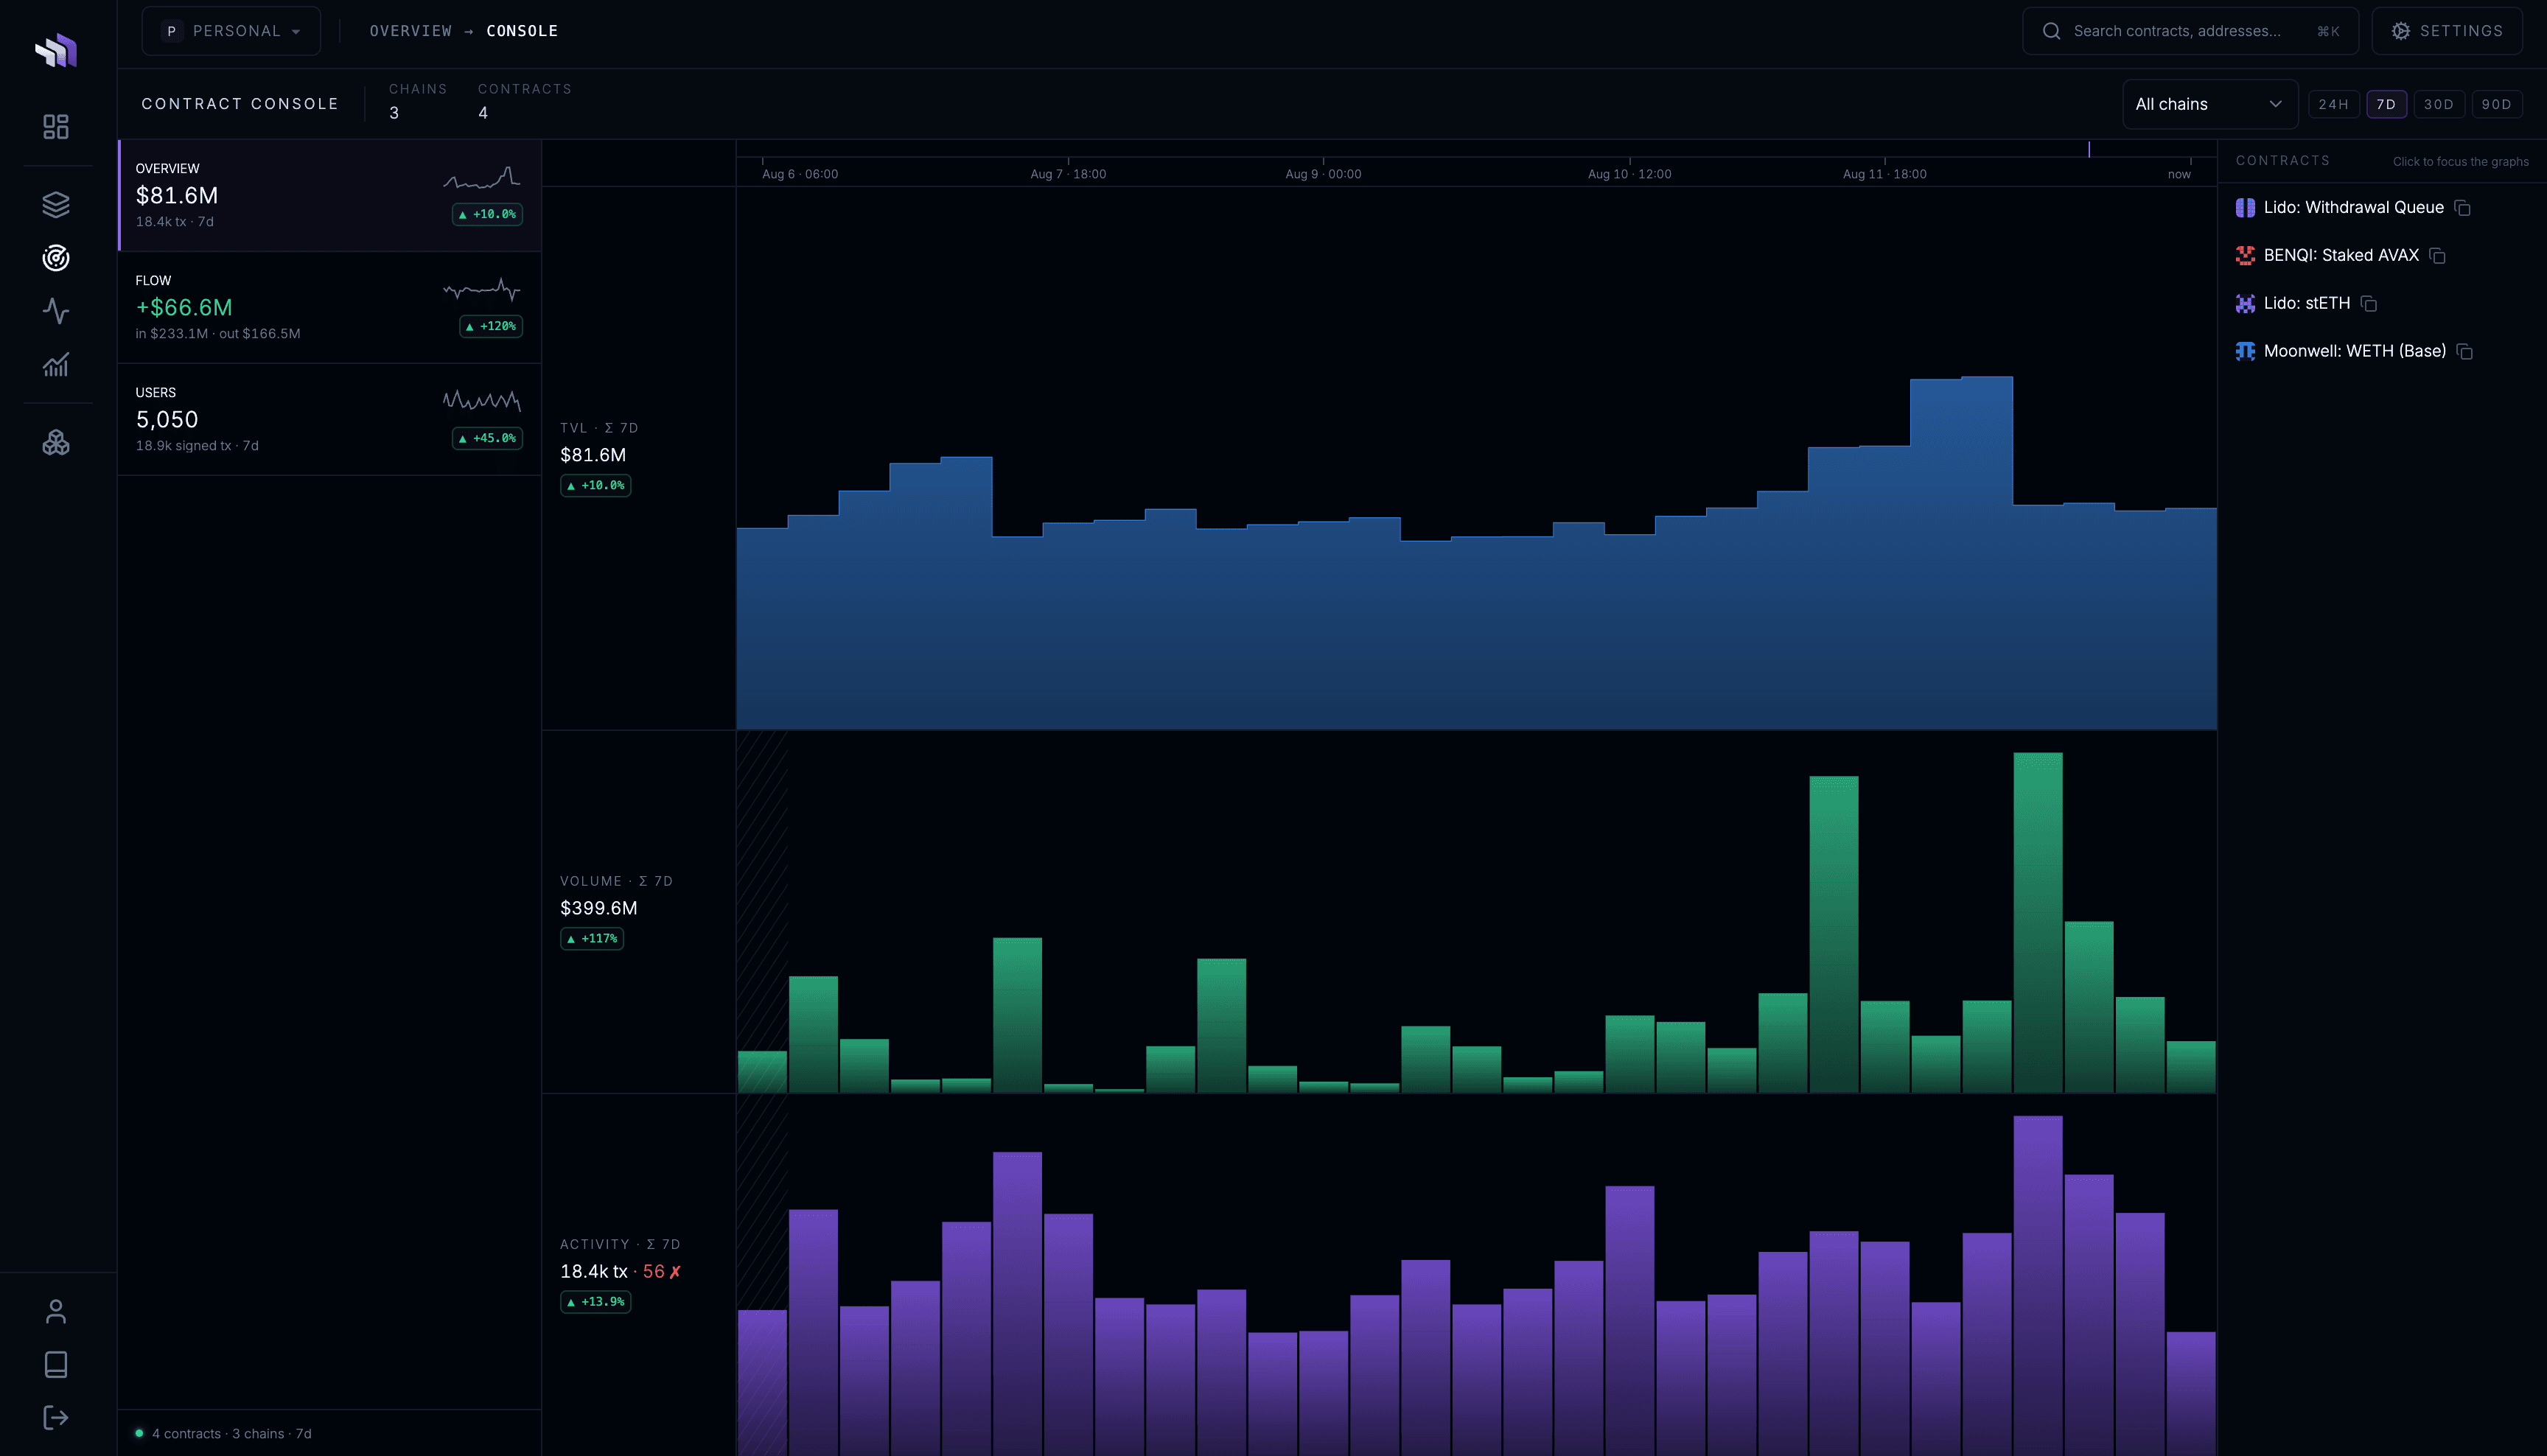
The Console gives you aggregate analytics across all of your watched contracts.
Use it to understand how your application is operating over time: TVL, transaction activity, volume, value flows, counterparties, and users.
Overview
The Overview shows TVL, volume, and transaction activity across your contracts on the same timeline.
Use the time range to inspect the last 24h, 7d, 30d, or 90d.
You can also select individual contracts to focus the graphs on only those contracts.
Flow
The Flow view shows how value moves into and out of your application.
See:
- total inflows and outflows
- net flow
- the counterparties sending and receiving value
- the tokens being transferred
- value moving between your own contracts
Filter by token to analyse the movement of a specific asset.
Click a counterparty to inspect its relationship with your contracts in more detail.
Users
The Users view shows the wallets interacting with your contracts.
See active signers over time, the routes transactions take to reach your contracts, and the wallets generating the most activity.
Front doors show contracts such as routers and aggregators that users interact with before reaching one of your contracts.
Filter the Console
Use the chain selector to inspect one chain or your entire application.
The selected chain and time range apply across the Console.